
Most large websites suffer from an invisible problem holding back their website.
You keep publishing content at scale. You can see that your pages are indexed. And yet both your SEO & AI visibility declines... nobody can point to why.
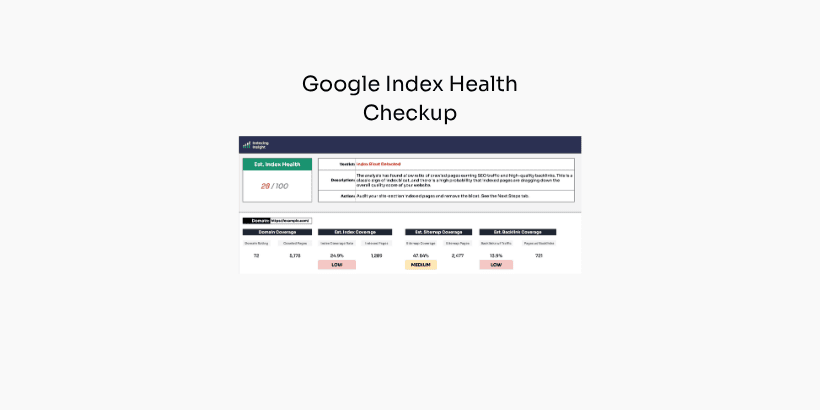
Now their is a solution. The Google Index Health Checkup.
It's a simple workbook that uses Ahrefs data to tell you whether a site has index bloat, and whether it deserves a deeper look.
This post walks through what it does, who it's for, and exactly how to fill it in.
How to use the Google index health checkup workbook.
This free checkup benchmarks the health of your site's presence in Google's index.
It helps a business quickly understand whether there are underlying Google index health issues, using easy-to-access Ahrefs data.
It's not a deep-dive diagnostic tool.
Instead, it's meant to point you in a direction.
So any website can understand at a glance whether they need to do any deep dive analysis.
Get the workbook below.
Just publishing content at scale isn't enough anymore.
Every company running a large website has watched the same pattern over the last few years: they publish more pages but see organic search traffic and visibility declining.
The usual suspects get blamed first: core updates, AI search, or technical issues. Sometimes things stabilise. Often they don’t.
But here is a cause almost no one investigates: your content is creating index bloat, which is dragging down your SEO and AI visibility.
By dealing with index bloat, you can help unlock your website's visibility.
This workbook is the first step in helping SEO teams uncover Google index bloat.
Before we dive in, I want to be clear about something.
This is not a deep-dive diagnostic. It will not tell you the full root cause of an indexing problem, and it isn't meant to.
What it does is give you direction.
It surfaces the signals that tell you whether a website is carrying index bloat, so you know whether to commit time to a proper investigation.
Think of it as a flag, not a verdict.
If you suspect a site has indexing or index bloat issues, this workbook can help you:
All it needs is Ahrefs data to work.
The Google Index Health Checkup workbook can be completed in 3 steps:
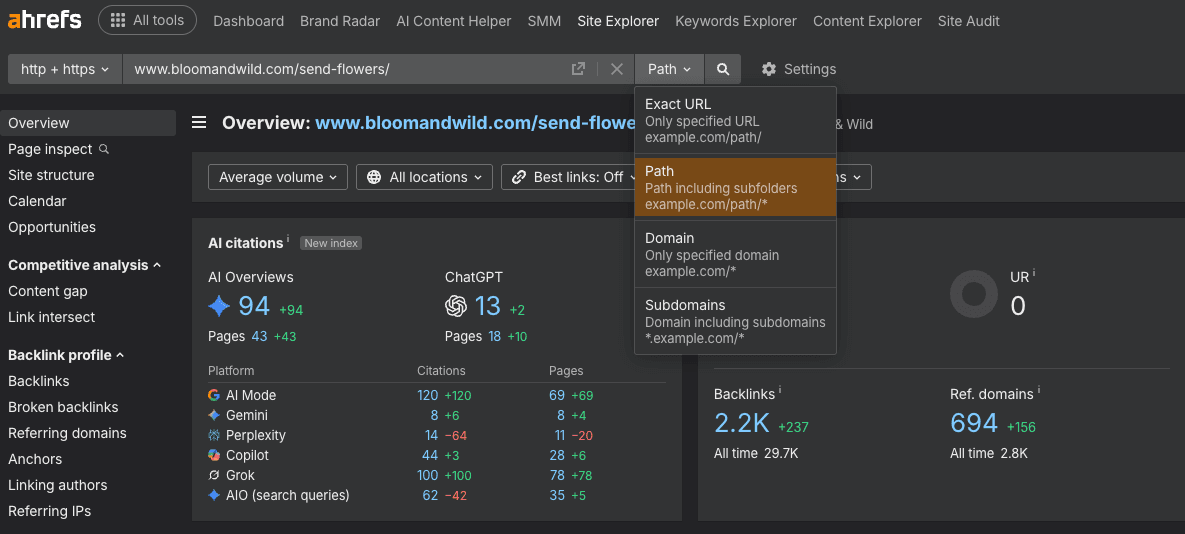
Open Ahrefs.
Enter the domain or subdomain you want to monitor. When you enter the domain, set it to Path, not domain or subdomains.
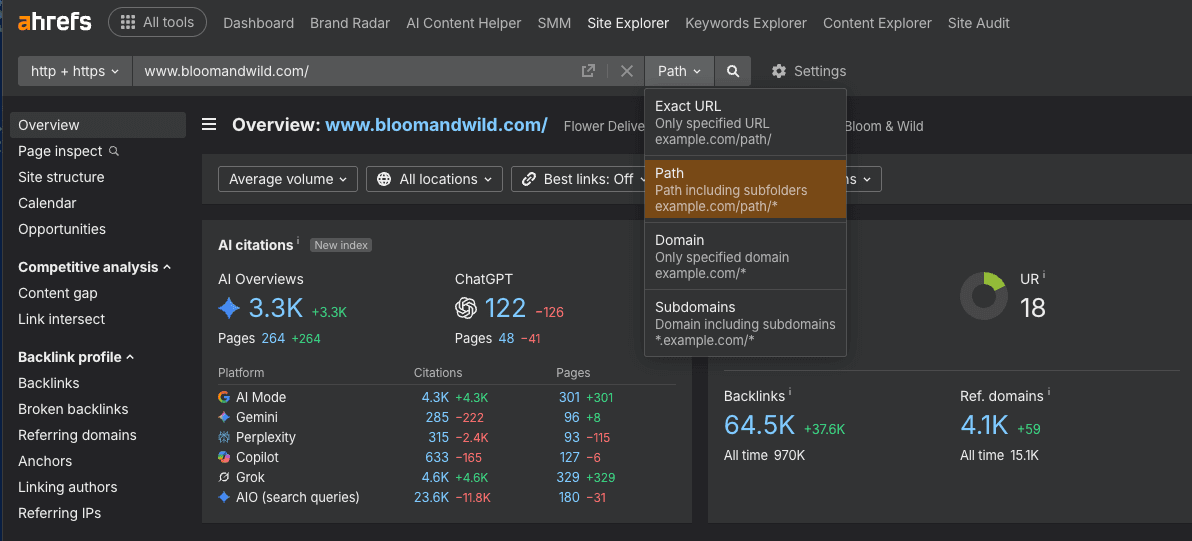
Setting the site explorer to Path is important moving forward.
Site quality tends to be attributed at the subdomain level, usually the www version of a site. You don't want documentation, developer or help subdomains muddying the data. You only want the main part of the site you intend to act on. Do this even for non-www domains.
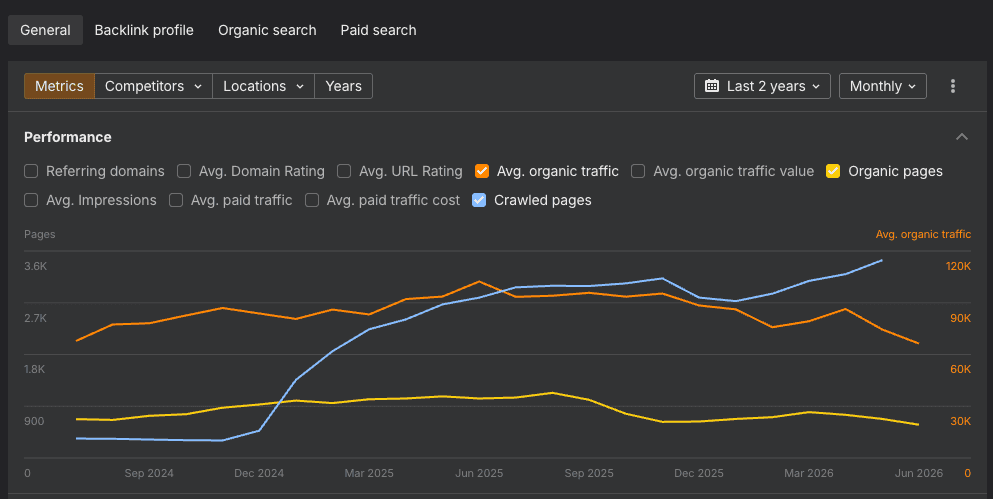
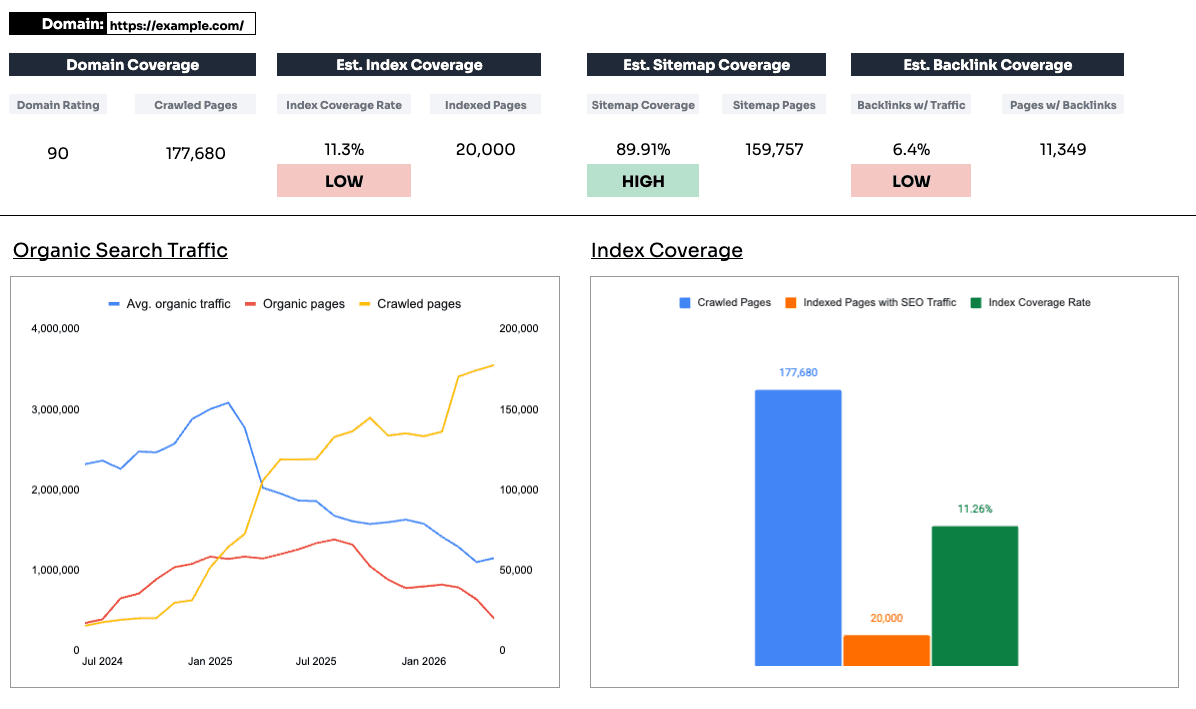
With the domain set to Path, go to the general overview and take three metrics:
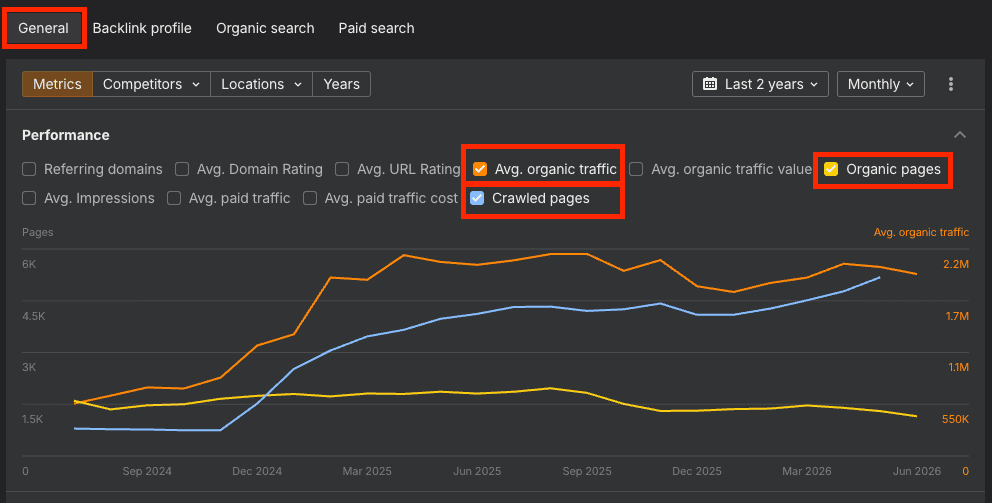
Then, set the date range to 2 years and the interval to monthly.
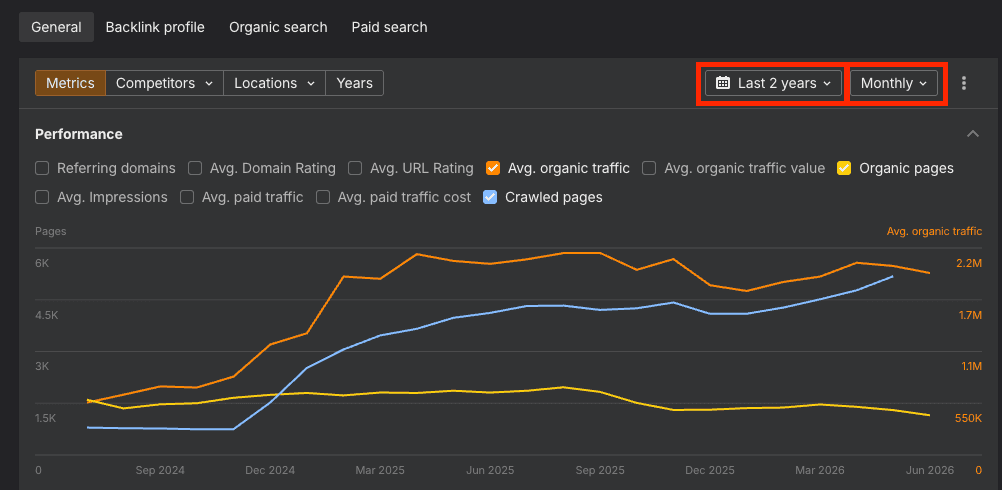
This gives you a clear picture of what's being crawled, how many pages appear in the top 100 results, and how the site's organic performance is trending.
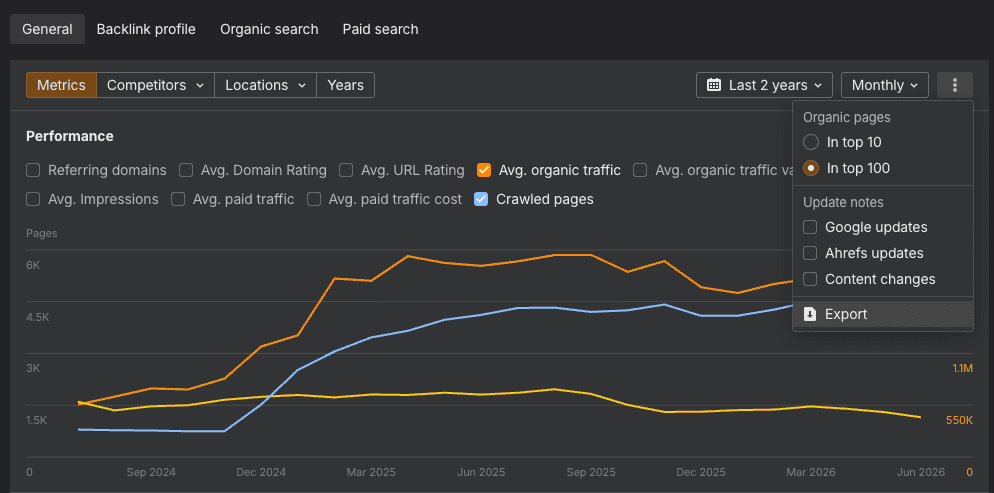
To export, untick any notes, make sure it's set to "in top 100", and hit export.
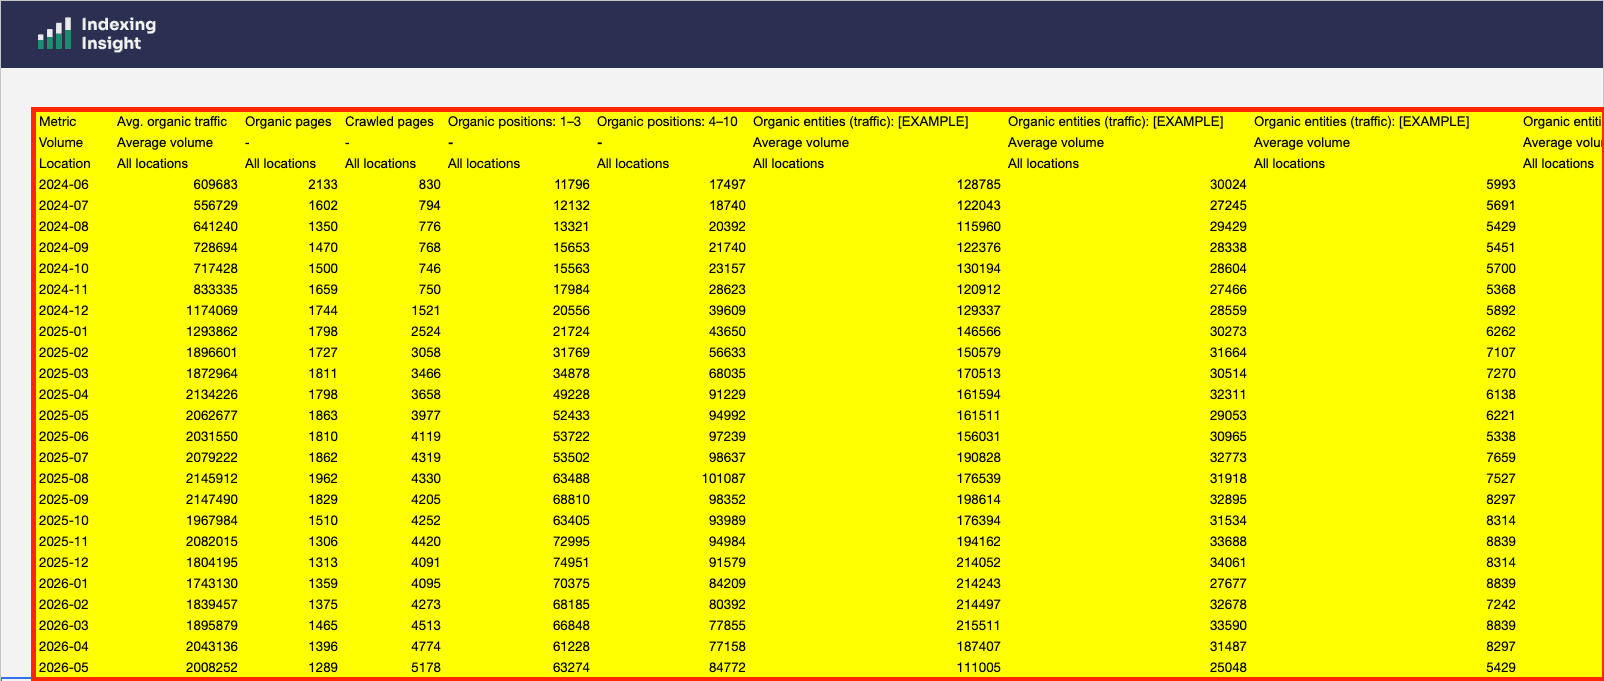
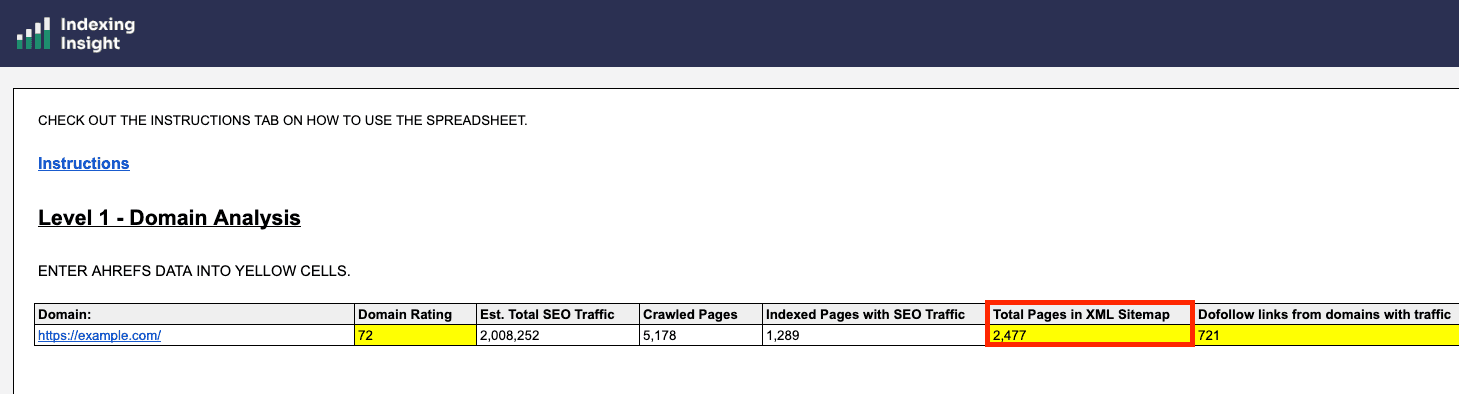
Open the Historic Performance tab and paste the exported spreadsheet data into the yellow cells. And make sure you paste it in the right place!
That's the whole step.
From here the workbook does A LOT of the work for you.
The Index Coverage Analysis tab, the scorecard, and the organic search traffic graph all populate automatically from what you've pasted in.
Easy mate.
But we do need to do some manual data inputting before we're finished.
Two more inputs to grab from Ahrefs.
First, find the Domain Rating of the domain...
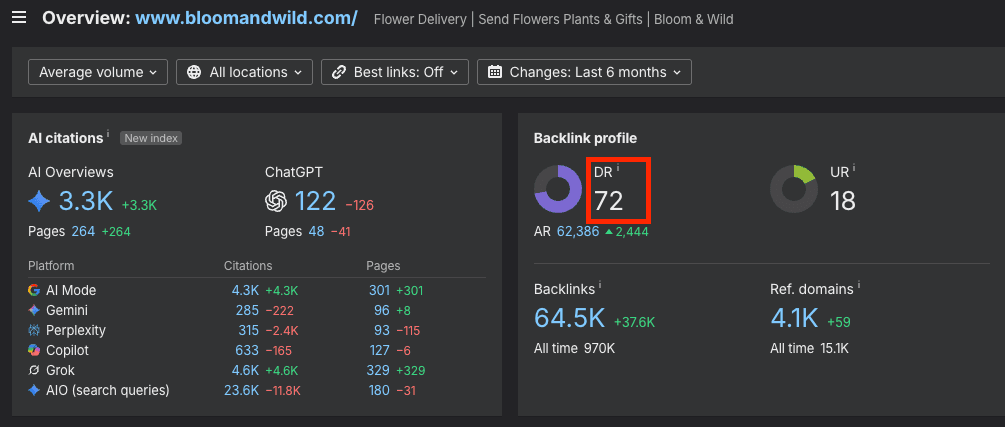
...and paste the value into the tab.
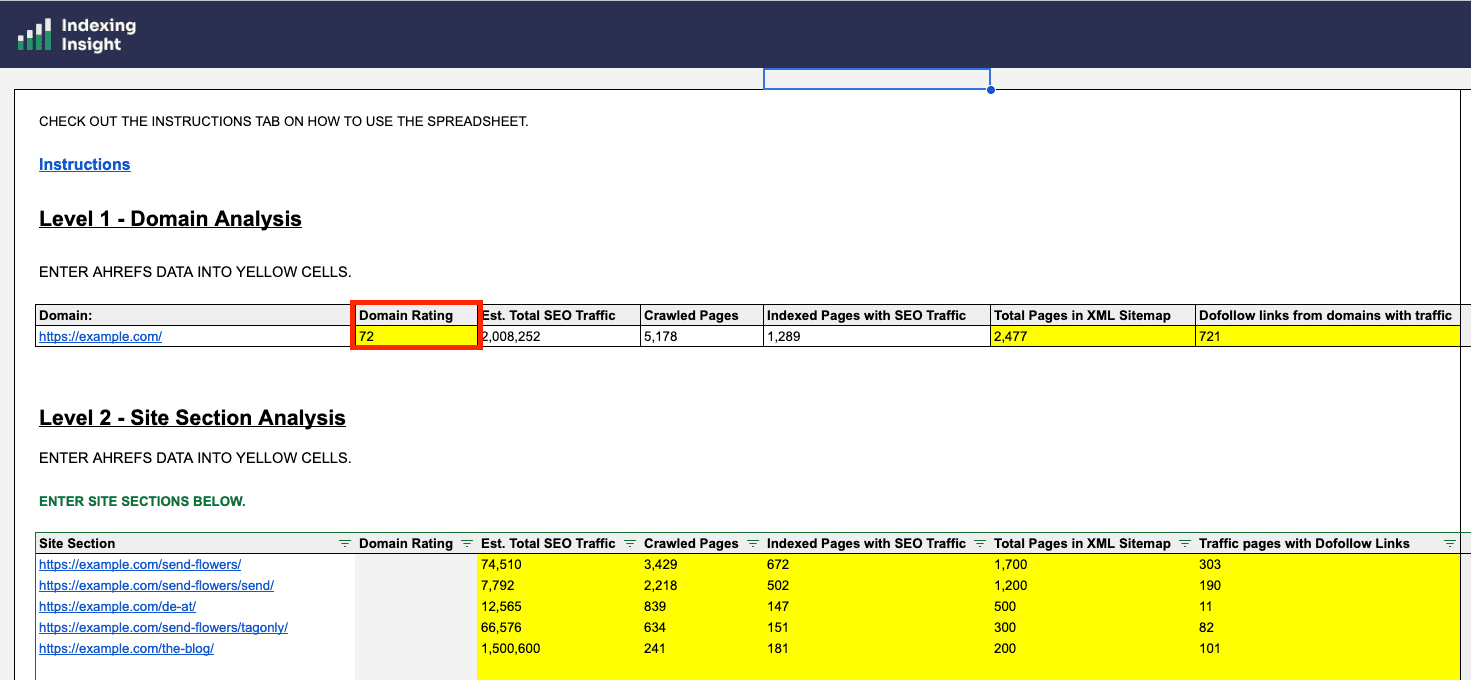
Next, the do-follow links from referring domains with traffic.
In Ahrefs, go to Best by links, filter to do-follow, then add a filter for referring domain traffic and set it to at least 1, and apply.
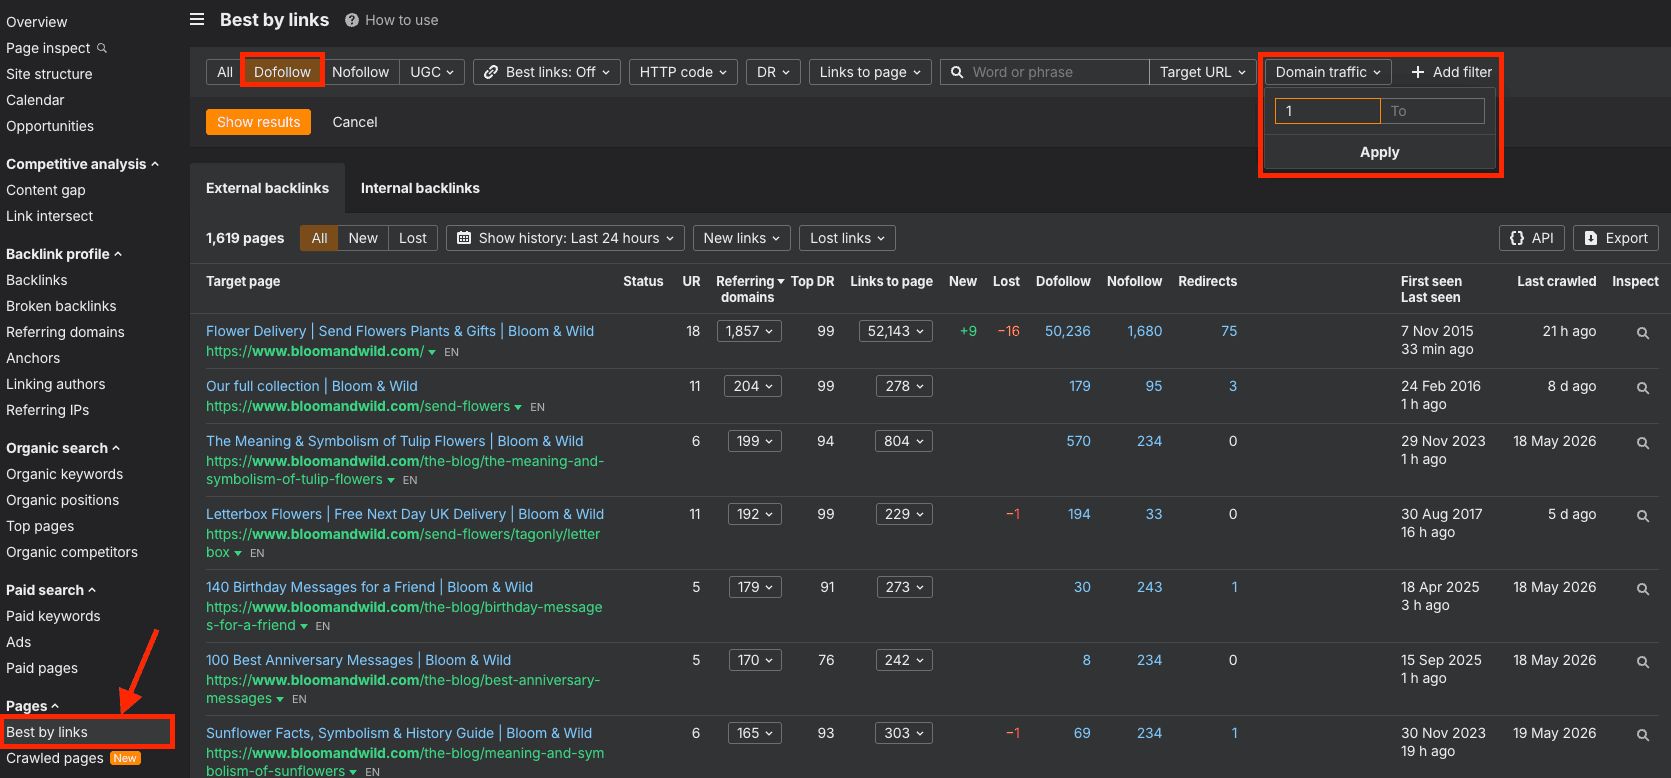
Why filter for domains that get traffic?
Because around 97% of the internet gets no traffic at all. A do-follow link from a domain that actually earns traffic is far more trusted, in the nearest-seed PageRank model, than a link from a page nobody visits.
You want to count the links that carry weight.
Then copy the total number of pages from the dashboard...
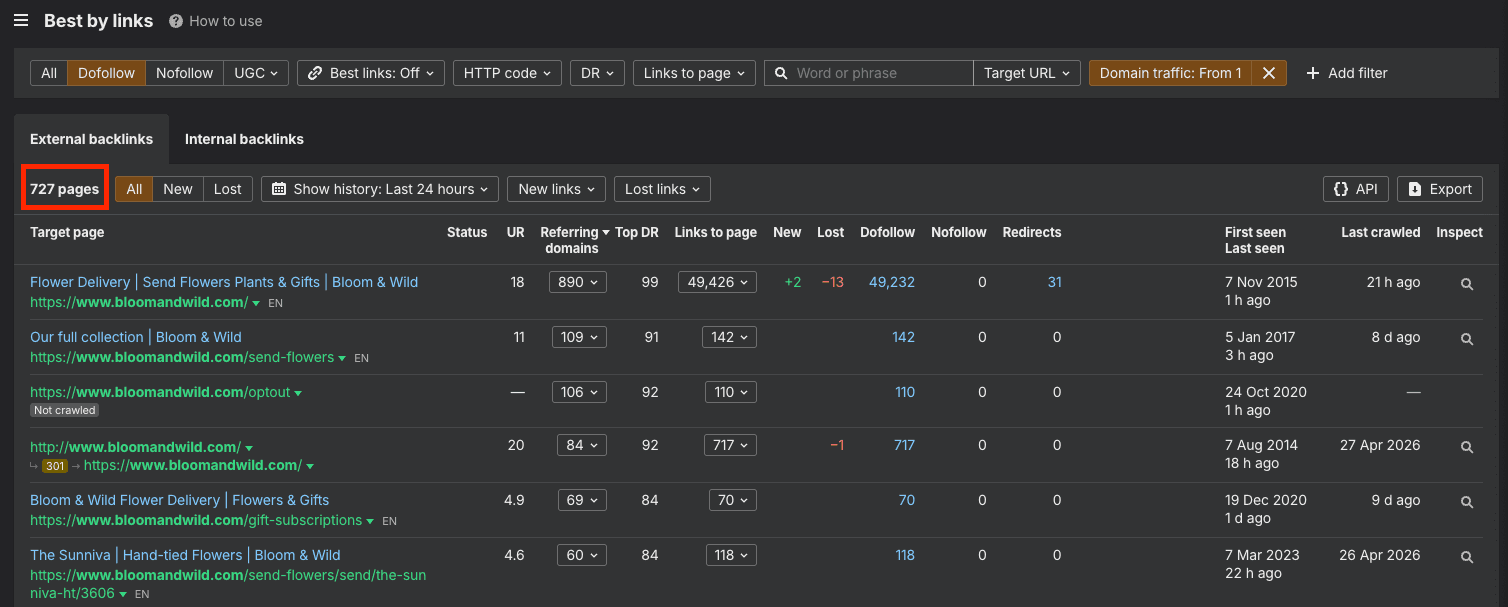
...and paste the figure into the sheet.
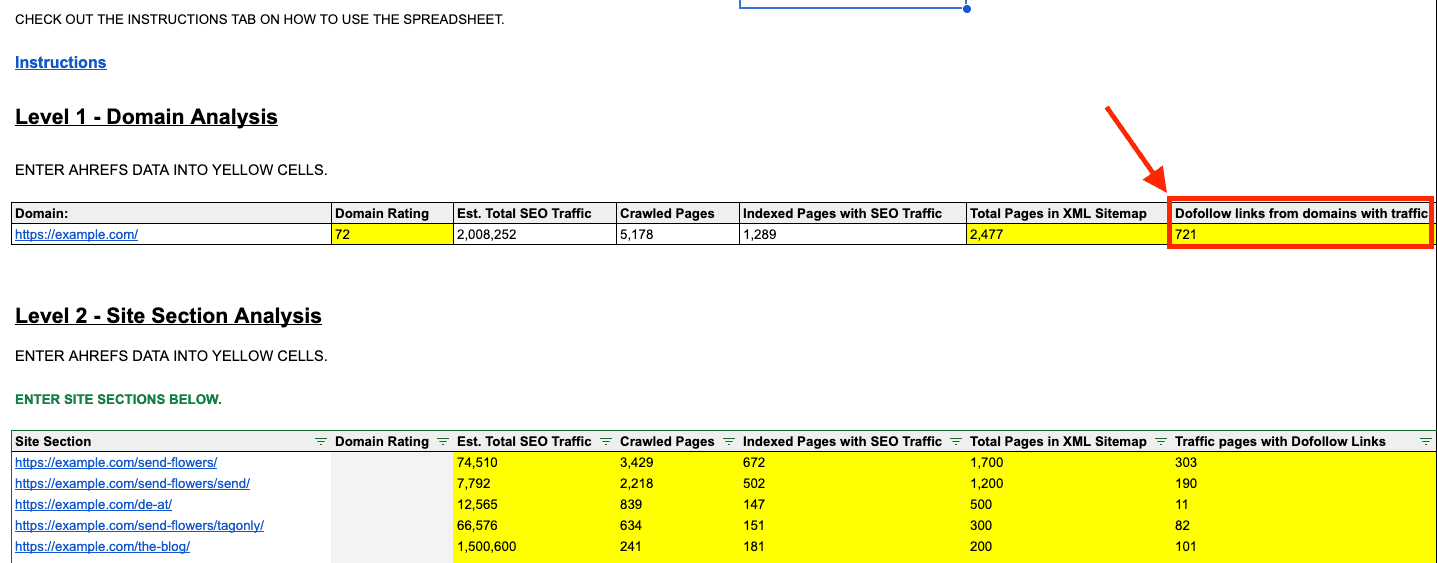
This is the one input that comes from outside Ahrefs.
It's optional. But useful if you want to get a more accurate estimate of your index coverage.
There are 3 common ways to find a website's XML sitemap:
Then you'll need to count the total number of pages in an XML sitemap. You have two ways to count the pages inside it:
Don't overthink this.
You're after a rough figure for how many pages are in the sitemap, because that is the set of pages the site is telling Google it wants crawled and indexed.
Enter that number into the workbook, and the scorecard is complete.
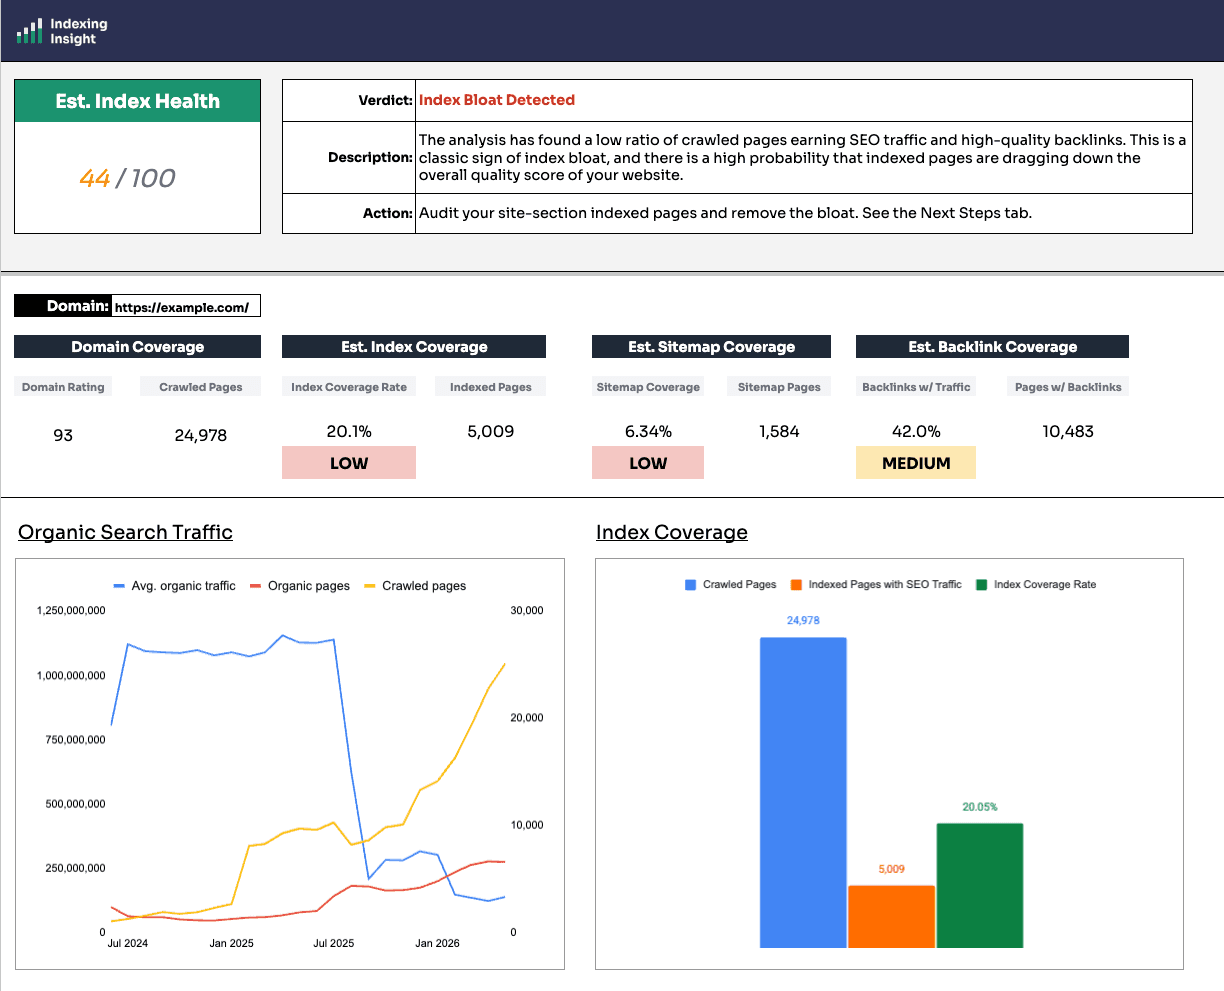
Once your numbers are in, you can now check your Google index health verdict.
If you're verdict is reporting Index Bloat Detected or Index Health OK then move onto the next step.
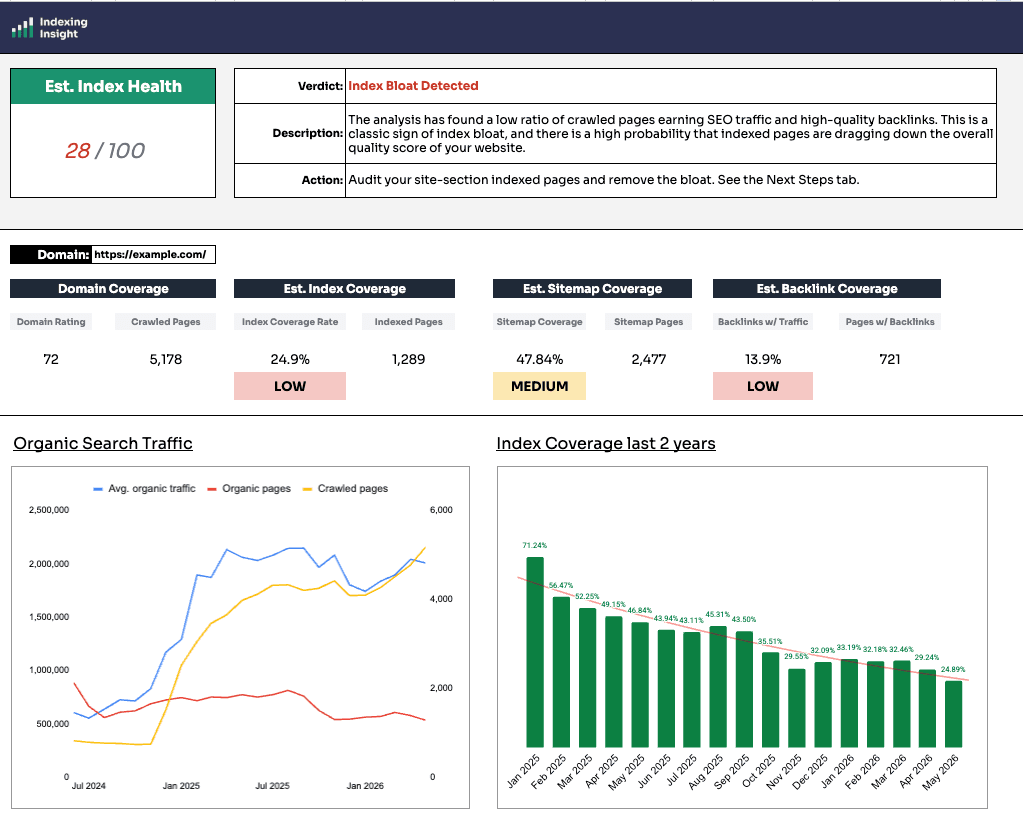
The scorecard calculates 3 index coverage scores based on the numbers you've just inputted into the sheet:
This is the headline metric.
It's calculated from the number of crawled pages found by Ahrefs against the number of pages getting traffic.
The logic: if a page is getting organic traffic, it is indexed. Google can only show a page in search if it has been selected into the index, so traffic is a reliable proxy for indexation.
You want this number high.
A low Index Coverage Rate means lots of pages are being crawled relative to how many actually appear in search, and that's the shape of index bloat.
As a rough benchmark of good vs bad Google index health score:
This compares the pages in your sitemap against the pages Ahrefs is crawling.
A large gap can mean a few different things. Parameters or facets on an ecommerce site might be inflating the crawled count, in which case it isn't a worry. Or the sitemap might not reflect what's actually being found and indexed.
The workbook includes a toggle (cell M15) that lets you use the total sitemap pages as the baseline instead of crawled pages.
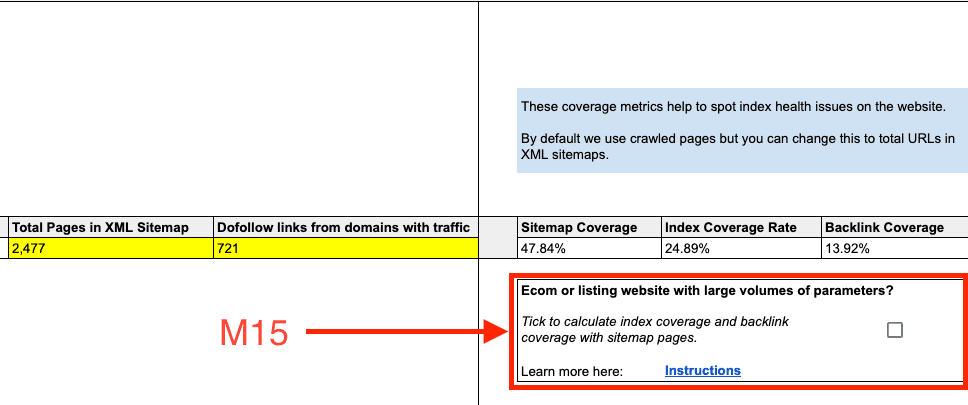
If you trust the sitemap is clean, with the right pages in it and few 404 or duplicate problem pages, this can be the more accurate baseline. When that toggle flips, the score can shift meaningfully and so can the site sections below it.
Caution: don't tick that box just because you don't like the crawled-pages number. Be honest with yourself about whether the sitemap is genuinely the better baseline.
This compares crawled pages against the number of pages with quality do-follow links from domains that get traffic.
These are some of the best links a site can have.
It will never reach the 50% to 70% range, and that's expected. But you'd generally want more than around 13% of pages to be earning links. It's a score and an indication, and it becomes most useful in the next stage.
A reminder runs through all of this: Ahrefs data is an estimate. It can underreport. Treat every number here as a direction, not gospel.
This is the real juice of the workbook.
You need to complete level 2 of the Index Coverage Analysis tab. To do this, you need to follow these steps:
First, you need to breakdown the website into site sections.
To do this, you need to identify the URL directories (https://www.example.com/product) with the largest number of pages. It seems like a large task but in fact most website's follow the same pattern.
The best way to find the site's largest directories (quickly) is to look at the main navigation and footer of a website.


Here are a few examples of what to look out for:
Ecommerce websites
SaaS websites
Travel websites
When you have identified each folder path, time to input it into Ahrefs.
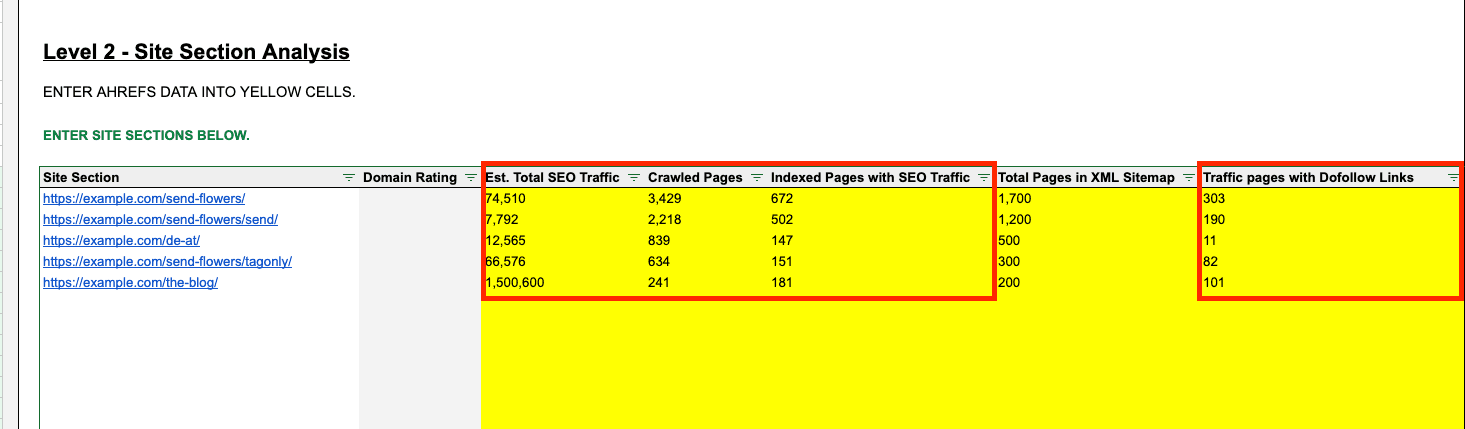
Break the site into its main sections by URL structure, for example /send-flowers/, /blog/, and any other directories.
Then input them into Ahrefs site explorer (remember to use Path).
Just like before, we want to input the following metrics for each site section:
Enter the metrics into Level 2 into the right columns:
Optional: Total Pages in XML Sitemap
Finally, fill in the total pages in XML Sitemap for each site section. This will require you to have your XML sitemaps set up for each directory or page template (and not everyone does this).
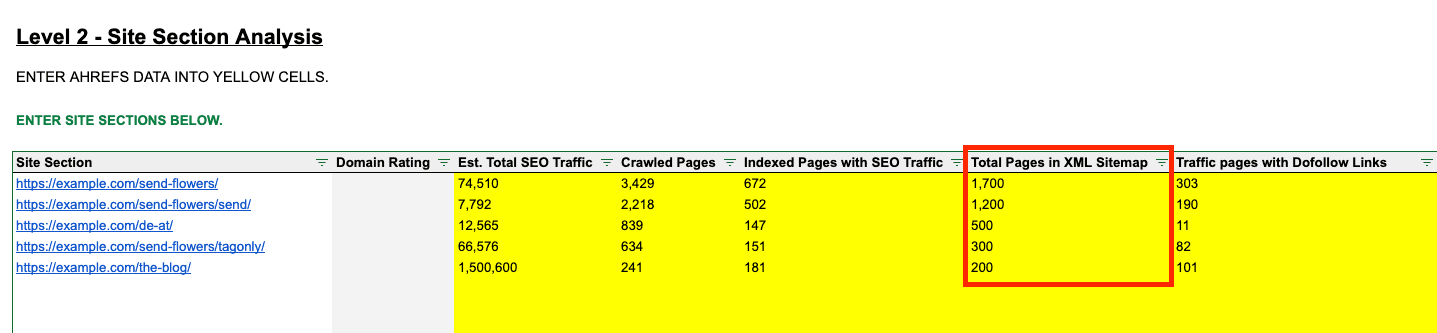
This is useful data if you want to use the sitemap baseline, skippable if a site doesn't break its sitemaps down by template.
Sort the table by site sections with the largest crawled pages.
Once each column has the right metrics inputted, and it's sorted, that's it!
Head back over to the scorecard.
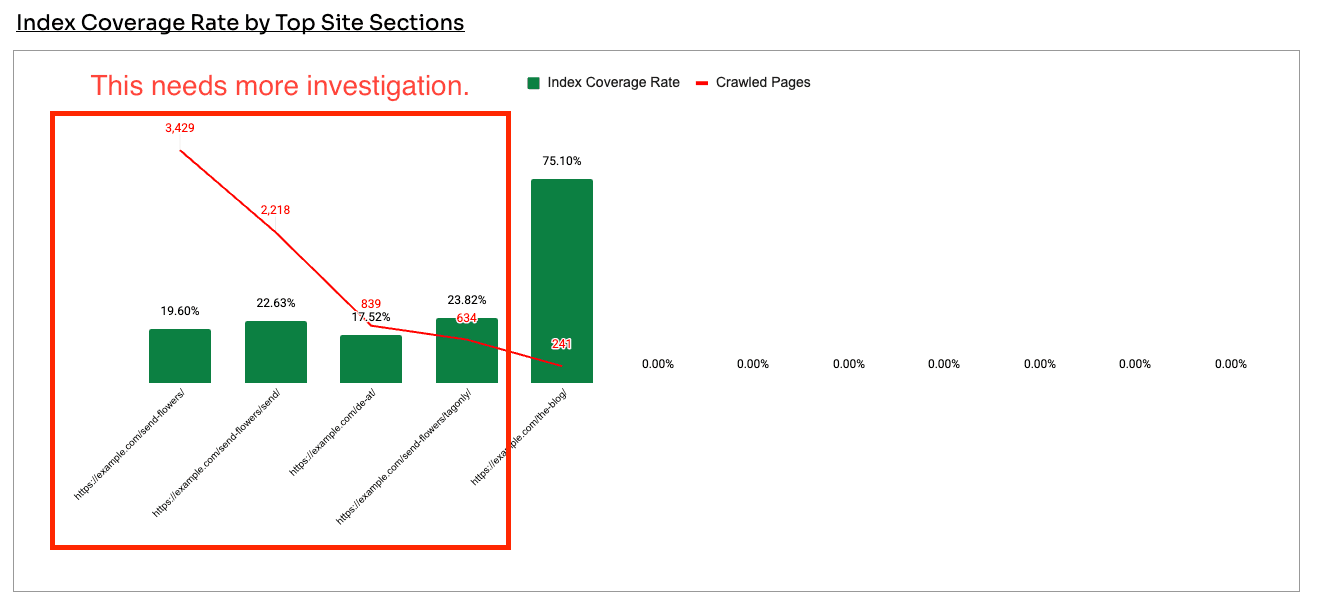
You need to Scroll down to the Index Coverage Rate by Top Site Sections.
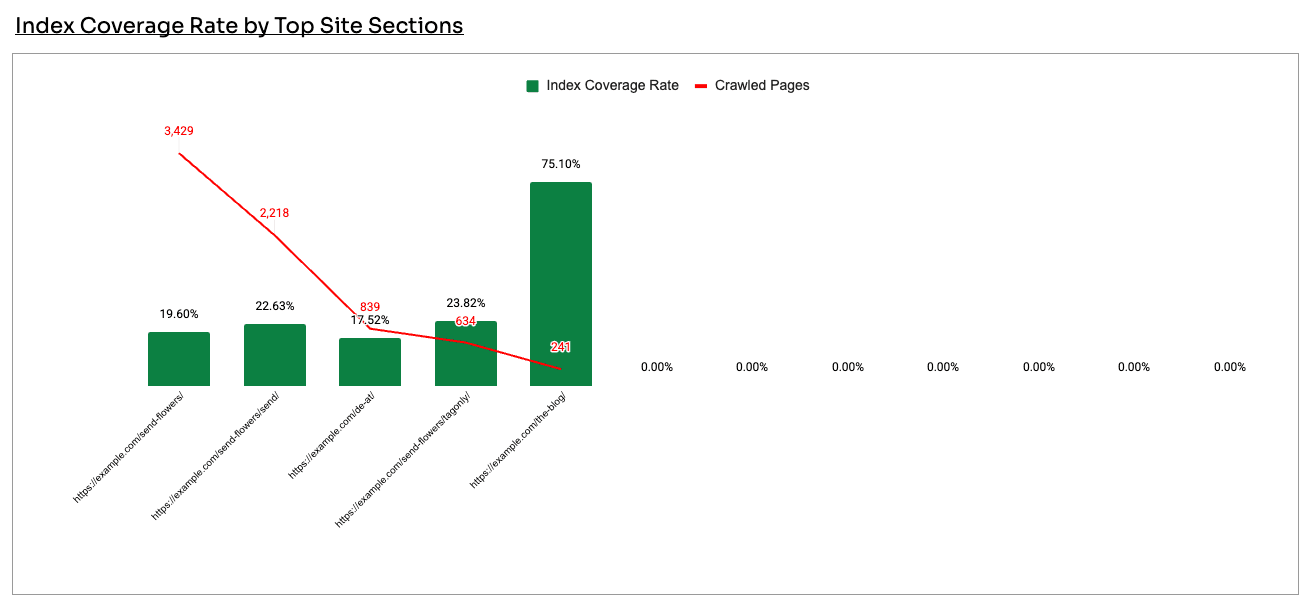
What this graph shows is the the largest site section by crawled pages and the index coverage score for each site section.
You're basically looking at the source of your potential index bloat on the left.
You also want to combine this graph with the Backlink Coverage Rate by Top Site Sections below.
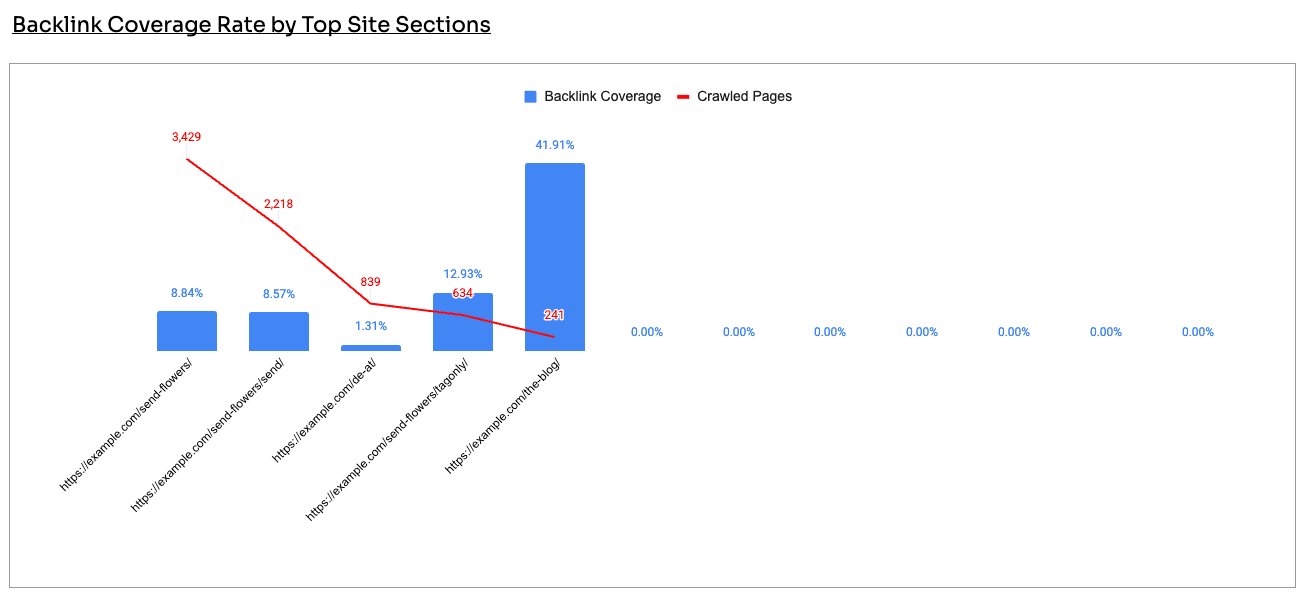
Here's why it matters.
When traffic drops and crawled pages spike, the reflex across SEO is to blame the 'AI content slop'. It's the go-to explanation.
But that's not what the data says.
In this example, a flower retailer had a clear decline in organic pages and traffic alongside a rising crawl count. The blog was the obvious suspect.
The data said otherwise: the blog was healthy, with around 75% index coverage and strong backlinks.
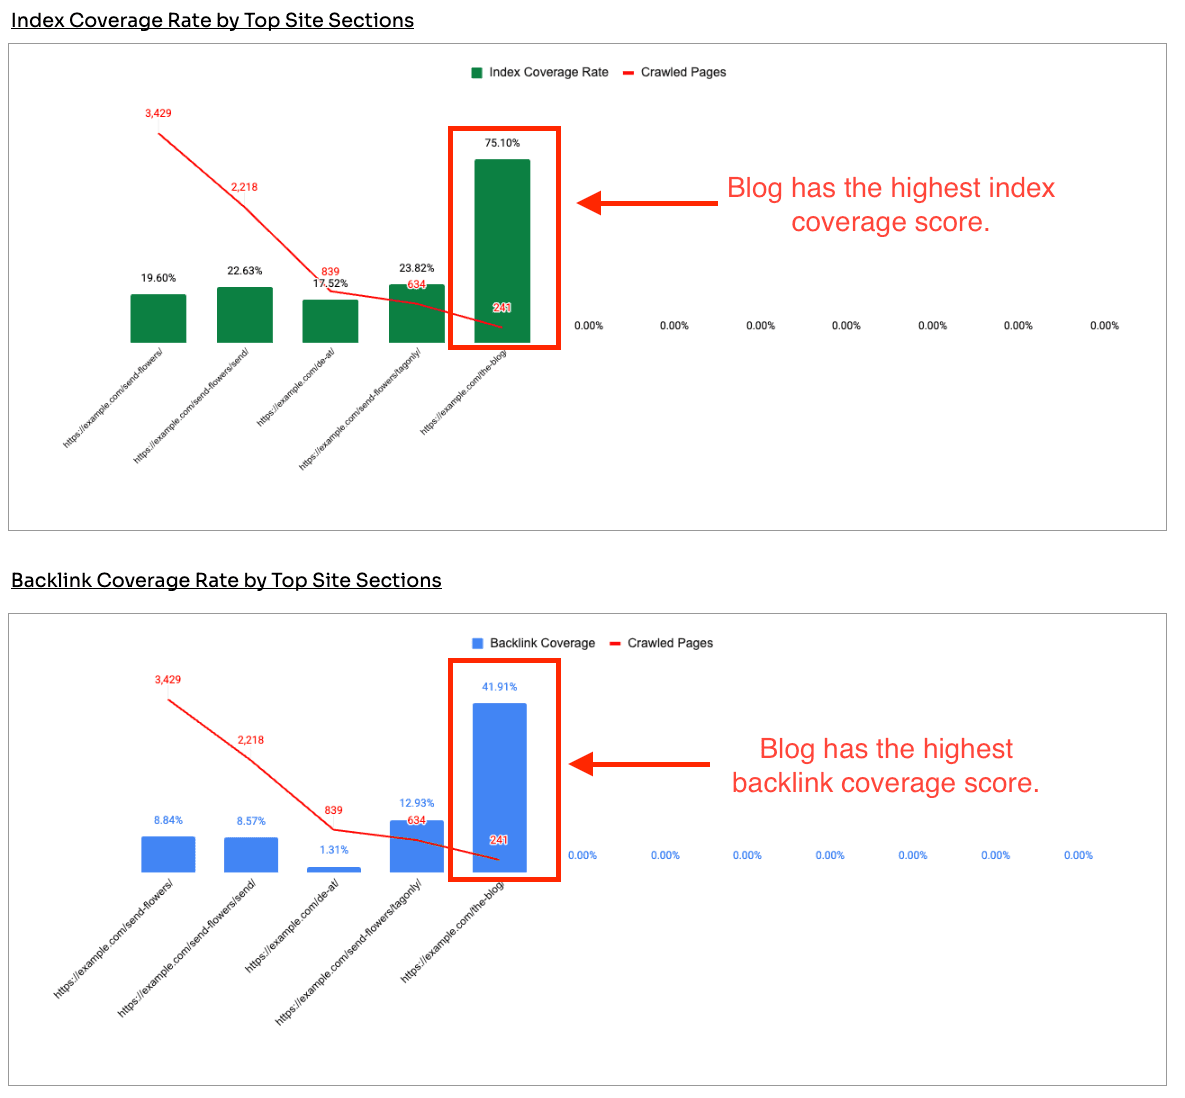
The actual problem sat with the product and category pages, which had huge crawl volume, low index coverage, and few links. That's where the SEO team and business should spend it's time investigating potential index bloat.
Before reaching for the scissors, check backlink coverage. The instinct to cull whole sections is common, but you don't want to cut sections that are earning links. Which is why it is important to track.
Two more examples show the same lesson from different angles.
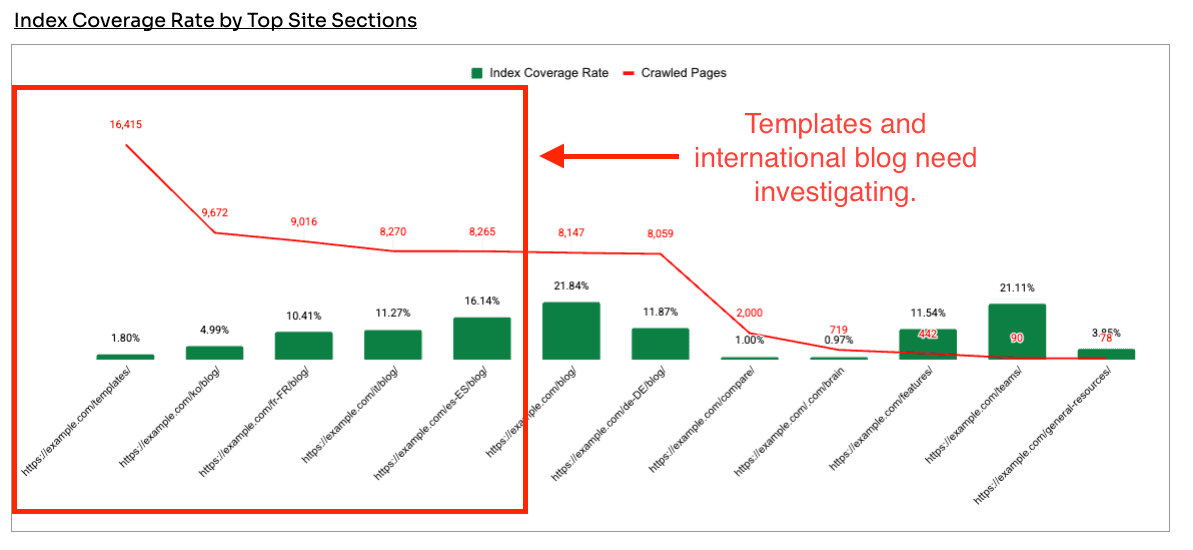
A well-known B2B software company has classic signs of index bloat. A decline in SEO traffic and organic pages over the last 2 years. And a MASSIVE increase in crawled pages.
Many would argue that it's an AI issue caused by blog content, but its real bloat was in template pages and international blog sections.
A B2C brand with tanking traffic and skyrocketing crawled pages.
When reviewing the site sections we can see that each folder has a lot of powerful links BUT there are still areas of the website with 2% to 30% index coverage. Which is exactly the kind of mismatch that warrants investigation.
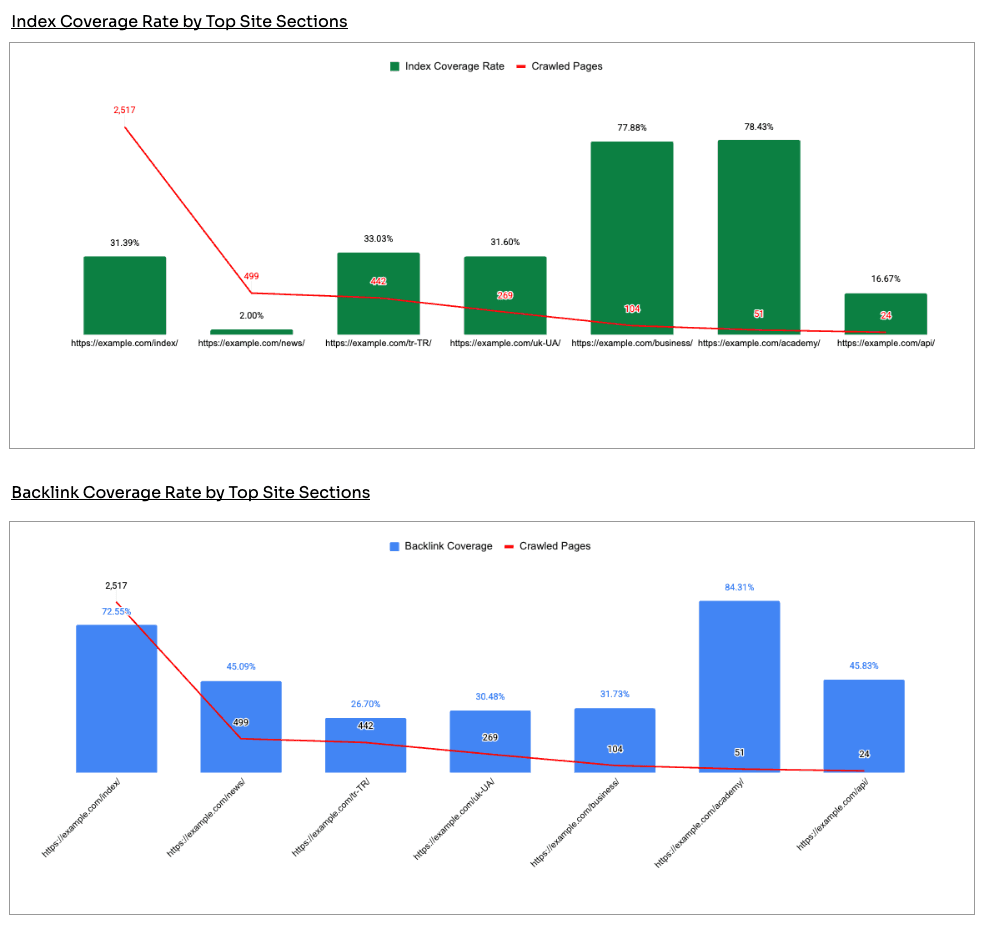
The pattern to notice is a section where pages are crawled heavily, earn links, and still don't appear in search.
That gap is the flag.
The next step is a deeper diagnostic dive of your website.
If the verdict is Index Bloat Detected or Index Health OK, you need to do a deeper dive into your index bloat.
Pull Google Search Console data and run a content audit on the site sections with the most crawled pages.
We recommend doing the following:
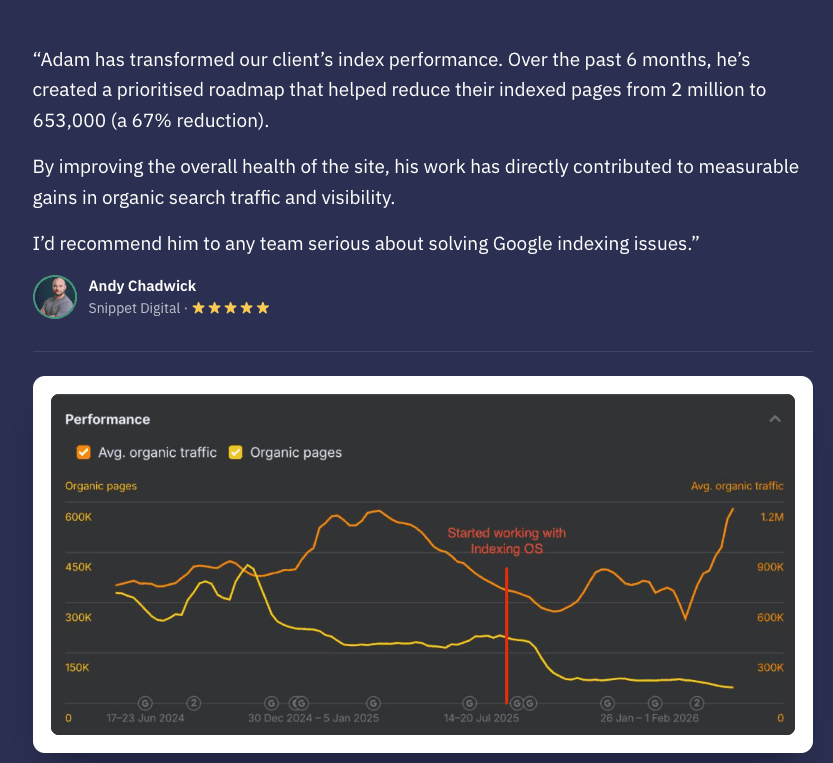
Dealing with that does measurably help, across both traditional and AI visibility.
This Google index health workbook gives you the direction. However, it is not a deep dive diagnostic. That is the next step.
To monitor indexing data at scale, across up to a million pages, and keep layering it over analytics to protect your site's quality, that's where ongoing index monitoring takes over.
Have you checked whether your crawled pages are actually appearing in search, or just assumed they are?

Adam Gent
SEO Product Manager and Technical SEO. I’m currently an independent consultant who works with organisations to plan, scope and execute SEO projects that drive results.